EXODUS
![]() FAST
FAST![]() CHEAP
CHEAP![]() GOOD
GOOD
Reservoir Simulator for
Microsoft Windows™
Now With REVELATIONS ( Assisted History Matching)
First Released in 1992
Current Version: 10
3
Dimensional 3 Phase Compositional (K value) simulator
Fully
Implicit Formulation for maximum numerical stability
Fast
Iterative Multi-core solver
NEW! Youtube channel
See our growing list of tutorial movies
on How to use Exodus at
https://www.youtube.com/playlist?list=PLL7cbAoGCdeJPAYxyo2BWoispPY6siFY8
Some of the features ………….
|
|
|
“Exodus is elegant
and extremely easy to use. The
graphics are superb and execute flawlessly” - Dr. S.M. Farouq Ali
User Friendly…………….
|
o
Import contour maps, build grid over maps and infill
cell values o
Import well surveys and find well locations o
Template to Create Multiple Hydraulic Fractures for
Long Horizontal Wells o
Automatically build dual domains for Naturally
Fractured Reservoirs
o
Tabular reports for wells, regions of reservoir o
Quick Well Charts Generation o
Multi-Window 2D, 3D views and animations of grid
cell parameters |
Simulator Applications ………….
![]() Conventional and Unconventional Reservoirs.
Conventional and Unconventional Reservoirs.
![]() Full Field, Pattern, individual well performance.
Full Field, Pattern, individual well performance.
![]() Black Oil, Gas condensate, Shale Gas.
Black Oil, Gas condensate, Shale Gas.
![]() Coal Bed Methane Reservoirs. (Abstract SPE 75672)
Coal Bed Methane Reservoirs. (Abstract SPE 75672)
![]() Multiple Vertical Hydraulic Fractures at
specified times for horizontal wells
Multiple Vertical Hydraulic Fractures at
specified times for horizontal wells
![]() Waterflood, Gas reinjection.
Waterflood, Gas reinjection.
![]() Polymer flood, Alkaline Surfactant Polymer Flood.
Polymer flood, Alkaline Surfactant Polymer Flood.
![]() Coupled Surface Gas Gathering Network
Coupled Surface Gas Gathering Network
![]() Economic comparison of cases
Economic comparison of cases
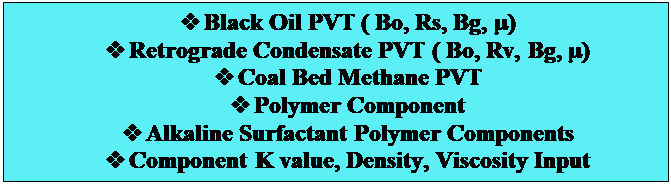
EXODUS Reservoir Simulator
consists of the following suite of programs
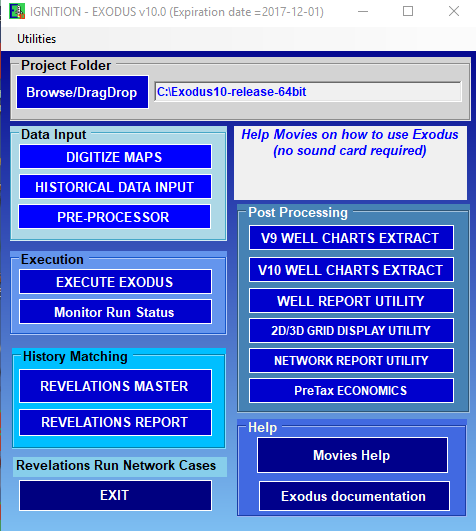
v Digitize Maps - contour maps may be traced and converted to digital form
v Historical Data Input - enter production and pressure history data
v PreProcessor – Create/Modify/Save a
complete data set for the simulator
v Execute Exodus – Starts Simulation Runs for specified data sets
v Monitor Run Status – Shows progress of selected runs
v WellCharts Extract – create
multiple 2D/3D charts of well(s)’s simulated and historical data
v Well Report Utility – spreadsheet reports of well(s)’s simulated results
v 2D/3D Grid Display Utility – multiple 2D (xy,xz,yz planes) and 3D maps of grid cell parameters
with time.
v Network Report Utility - reports of rates and pressures at Surface Nodes
and Segments at selected times
v Pre-Tax Economics - compare the present values of different cases given
price and cost data.
NEW!
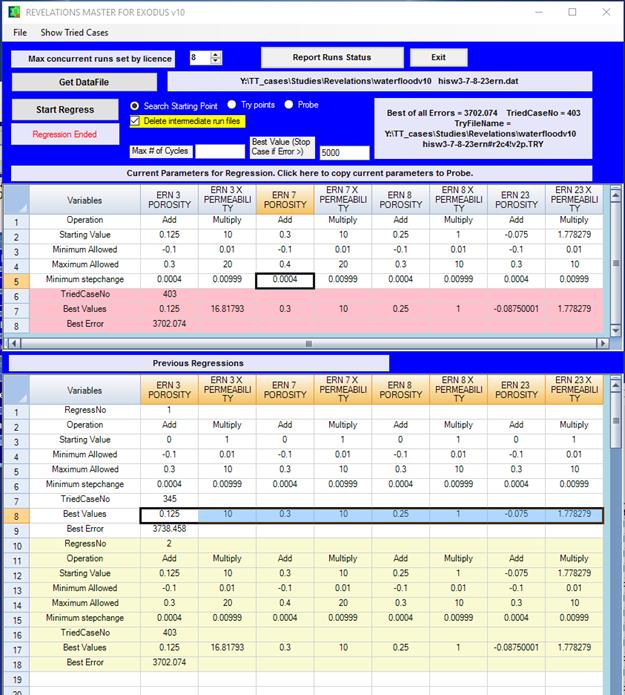
REVELATIONS - Assisted History
Matching
![]() Helps the user find the “best” match of historical wells’ production, and
pressure.
Helps the user find the “best” match of historical wells’ production, and
pressure.
![]() Varies grid cell values of selected grid parameters for selected regions
of the reservoir in search of the “best” match.
Varies grid cell values of selected grid parameters for selected regions
of the reservoir in search of the “best” match.
![]() Grid parameters can be net pay, depth, porosity, directional permeabilities, initial pressure and saturations, fluid
contact depths.
Grid parameters can be net pay, depth, porosity, directional permeabilities, initial pressure and saturations, fluid
contact depths.
![]() Initial values, minimum and maximum values for grid parameters can be set
and the “best” match searched for within these bounds.
Initial values, minimum and maximum values for grid parameters can be set
and the “best” match searched for within these bounds.
![]() Revelations Master will launch a regression cycle of many try cases in
the domain specified by the grid parameters value boundaries.
Revelations Master will launch a regression cycle of many try cases in
the domain specified by the grid parameters value boundaries.
![]() On a shared network folder, the many try cases can be simultaneously run
by Revelations Run Network installed on several computers on the network. With
enough Revelations Network licenses, all the try cases can be run in the time
it takes to run one case.
On a shared network folder, the many try cases can be simultaneously run
by Revelations Run Network installed on several computers on the network. With
enough Revelations Network licenses, all the try cases can be run in the time
it takes to run one case.
![]() Revelations Master will monitor and get the “best” try case. From this case, additional try cases will be
launched and the regression cycles continued until no improvement is obtained.
Revelations Master will monitor and get the “best” try case. From this case, additional try cases will be
launched and the regression cycles continued until no improvement is obtained.
![]() Revelations can also run a large number of try cases with user specified
values, or probe a range of regression parameters with random values to find
possible local best cases.
Revelations can also run a large number of try cases with user specified
values, or probe a range of regression parameters with random values to find
possible local best cases.
![]() Historical observed values to match are entered on a well basis and
consist of rates, cumulatives, and pressures. Weighting Factors can be applied
to values.
Historical observed values to match are entered on a well basis and
consist of rates, cumulatives, and pressures. Weighting Factors can be applied
to values.
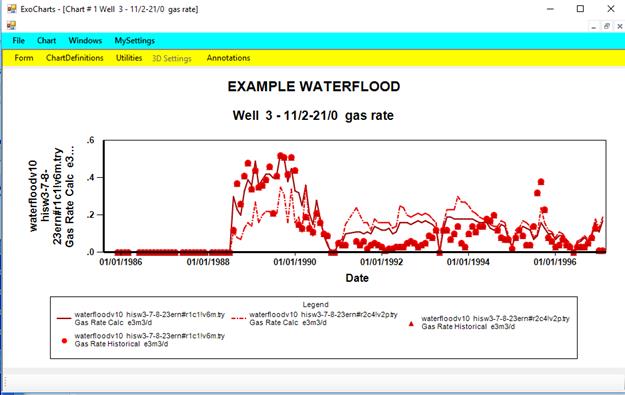
![]() Revelations Report shows the error in matching each historical value.
Tables and graphs of historical and calculated values, incremental and
cumulative match errors are provided.
Revelations Report shows the error in matching each historical value.
Tables and graphs of historical and calculated values, incremental and
cumulative match errors are provided.
![]() The well match errors may also be shown as bubble maps on time varying
grid maps such as pressure and saturations.
The well match errors may also be shown as bubble maps on time varying
grid maps such as pressure and saturations.
![]() Work flow demonstrated in tutorial movies.
Work flow demonstrated in tutorial movies.
Revelations Master
Revelations Run Network
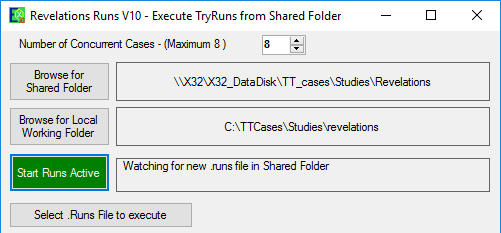
Execution Module.
When installed on multiple computers on the network, will run
simultaneously on each computer several try cases submitted to a common shared
folder.
This must be purchased for each computer.
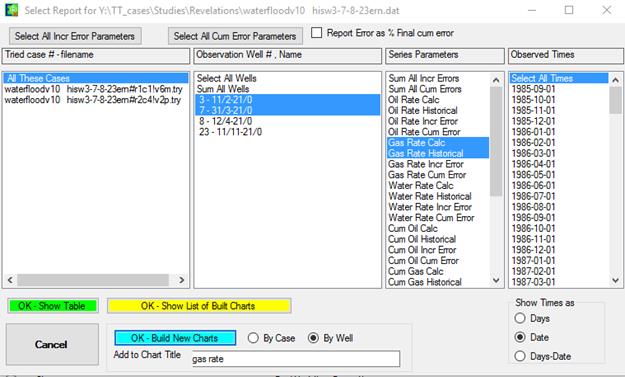
Revelations Report
Revelations Movies
Click on each title to start Youtube video
1.
Entering Historical Data in PreProcessor for
matching
2.
Defining grid cell regions in
Preprocessor for regression
3.
Preprocessor - Defining rings of cells around wells for regression
5.
Revelations Master – search for a match starting from initial values of
regression parameters
6.
Revelations Master – probing search region for better matches
7.
Revelations Master – user specified try points to find better matches
8.
Revelations Report – Tables and graphs of calculated vs historical
values
9.
Revelations – Grid Display Utility shows well bubbles of match errors
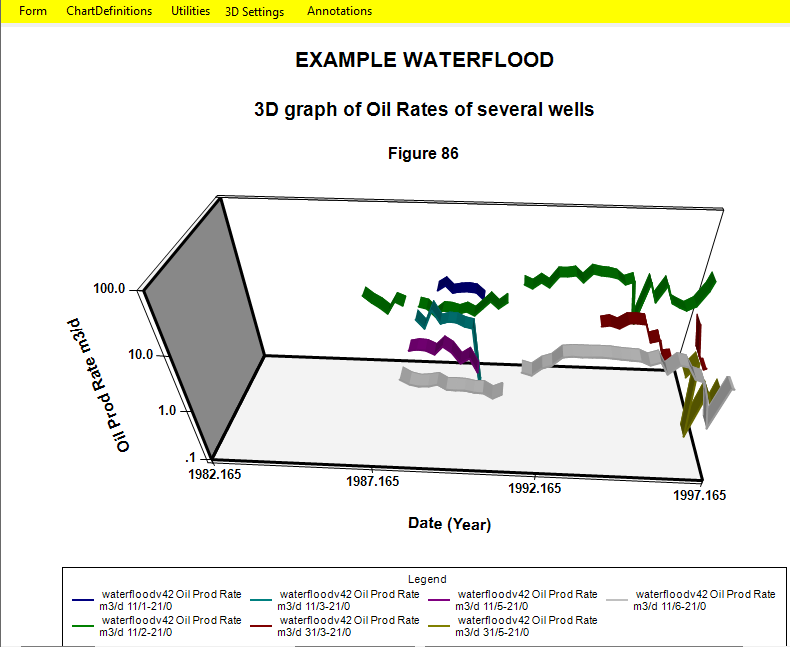
3D visualization (click on
picture to view animation)
·
Interrogate cell values, make cells invisible/visible
·
Use filters for visibility criteria
·
Rotate, Zoom, Clip layers, rows, columns.
·
Start, stop and resume animation of grid values.
·
Show internal isosurfaces,
surface contours of grid values.
·
Show well production rates and cumulatives as
proportionately sized colored barrels
3D Well Charts
Template to build Multiple
Vertical Fractures for long Horizontal Well
· Automatically
creates Local Grid Refinements along Fracture path
· Very small
central LGR planes to represent fractures
· Calculates
each fracture’s dimension using fracture tonnage
· Enhanced
Fracture permeability at specified times.
· Perpendicular
or Deviated Vertical Fractures
· Template
automatically removes, modifies, or rebuilds fracs
Price
·
Exodus is competitively priced based on the number of
active grid cells. Purchase only the version that will fit your reservoir
problems, and upgrade for the difference in price when necessary.
·
Network versions available with 3+ licenses
·
Single node locked license lease at low prices.
Contact us
For more information, please contact:
Thomas Tan, Ph.D, P.Eng.
T.T. & Associates Inc.
Phone : (403) 265-9722;
We welcome your enquiries!
(tant@petrostudies.com)